0%

Lab_notes

Lab1

Write a Python program to calculate the ROI (Return of investment) with the steps below

  • Create a variable earning and assign it value to 3765432.

  • Create the variable invest and assign it value to 1000000.

  • Create the variable roi and assign the formula
    $roi = \frac{Earnings - Invest}{Invest}$
    You can find more Markdown syntax about writing mathematical expressions here

  • Display the result

1
2
3
4
5
Earnings = 3765432
Invest = 1000000
roi = (Earnings - Invest)/Invest
print(roi)
#2.765432

Write a Python program to get the user input as a string and output the result in uppercase, lowercase and title.
You may find the input() function here.
You may also find the String methods here

1
2
3
4
5
6
7
8
x = input("type here plz:")
print(x.upper())
print(x.lower())
print(x.title())
#type here plz:ABCDKSF
#ABCDKSF
#abcdksf
#Abcdksf

Lab2

Write a Python program to find the maximum value of three numbers. You are REQUIRED to implement a function named max() to take three arguments and print print the result. e.g. max(5,56, 12) 56

1
2
3
4
5
6
7
8
9
10
def max(num1,num2,num3):
list = [num1,num2,num3]
tmp = 0
for i in list:
if i > tmp:
tmp = i
print(tmp)

max(5,56,12)
#56

Write a Python program to reverse a string. You are REQUIRED to implement a function named reverse() to take a string and return the result. Hint

1
2
3
4
5
6
7
8
9
10
def revers(str1):
rstr = ''
for i in range(1,len(str) + 1):
rstr = rstr + str1[-i]
print(rstr)

text = input("typing a string plz:")
revers(text)
#typing a string,plz:jack
#kcaj

Write a Python program to create and print a list where the values are first N square of numbers. You are REQUIRED to implement a function named printSquare() to take n where n is an positive integer.

1
2
3
4
5
6
7
8
9
10
11
12
13
14
15
16
17
18
# Please write your code here
# if 'first N' means input:6 -> output:[0, 1, 4, 9, 16, 25]
def printSquare(n):
list = []
for i in range(0,int(n)):
list.append(i**2)
return list

# if 'first N' means input:5 -> output:[0, 1, 4, 9, 16, 25]
def printSquare(n):
list = []
for i in range(0,int(n) + 1):
list.append(i**2)
return list


num = input("Please input an integer")
print(printSquare(num))

Lab3

Lists

1
2
3
4
5
6
email = "zhuo@hkbu.edu.hk"
list1 = list(email)
list1.insert(list1.index('@') + 1,'comp.')
print(list1)
email = "".join(list1)
print(email)

Below is an exmaple to accept an phone number and format the result.
You can use it to format for the currency as well.

1
2
3
4
5
6
7
phonenumber = input("plaz enter a phone number")
list2 = list(phonenumber)
list2.insert(4,'-')
phonenumber = "".join(list2)
print(phonenumber)
#plaz enter a phone number12345678
#1234-5678

If we wish to deal with the wordings in a sentence

1
2
3
4
5
6
7
8
sentence = input("plz input a sentence")
words = sentence.split()
print("First word:",word[0])
print("last word",words[-1])
#plz input a sentencetoday is a good day
#['today', 'is', 'a', 'good', 'day']
#First word today
#last word day

Sets

1
2
3
4
5
6
7
8
9
10
poem = "Mary had a little lamb, little lamb, little lamb, Mary had a little lamb, Its fleece was white as snow"
poem = poem.replace(',','')
print(words)
words = set(words)
print(words)
print("There are", len(words), "unique words in this peom")

#['Mary', 'had', 'a', 'little', 'lamb', 'little', 'lamb', 'little', 'lamb', 'Mary', 'had', 'a', 'little', 'lamb', 'Its', 'fleece', 'was', 'white', 'as', 'snow']
#{'a', 'Mary', 'was', 'Its', 'white', 'as', 'snow', 'lamb', 'fleece', 'little', 'had'}
#There are 11 unique words in this peom

Dictionary

1
2
3
4
examples = {'a' : 12, 'b' : 23, 'abc' : 8}
print(examples['a'], examples['b'], examples['abc'])
examples['cp3'] = 98
print(examples)

Let’s initialize a dictionary.

1
2
3
4
5
6
7
8
smallLetters = {}

for i in range(26):
smallLetters[chr(i + 97)] = 0

print(smallLetters)

#{'a': 0, 'b': 0, 'c': 0, 'd': 0, 'e': 0, 'f': 0, 'g': 0, 'h': 0, 'i': 0, 'j': 0, 'k': 0, 'l': 0, 'm': 0, 'n': 0, 'o': 0, 'p': 0, 'q': 0, 'r': 0, 's': 0, 't': 0, 'u': 0, 'v': 0, 'w': 0, 'x': 0, 'y': 0, 'z': 0}
1
2
3
4
5
6
7
message ='Python is an interpreted high-level general-purpose programming language. Its design philosophy emphasizes code readability with its use of significant indentation. Its language constructs as well as its object-oriented approach aim to help programmers write clear, logical code for small and large-scale projects.[30] Python is dynamically-typed and garbage-collected.'
for char in message:
if char >= 'a' and char <= 'z':
smallLetters[char] += 1
print(smallLetters)

#{'a': 29, 'b': 3, 'c': 14, 'd': 12, 'e': 33, 'f': 3, 'g': 15, 'h': 10, 'i': 23, 'j': 2, 'k': 0, 'l': 21, 'm': 8, 'n': 19, 'o': 20, 'p': 13, 'q': 0, 'r': 19, 's': 21, 't': 22, 'u': 5, 'v': 1, 'w': 3, 'x': 0, 'y': 7, 'z': 1}

The difference between ‘A’ and ‘a’ is 32. Same as all other pairs of small and capital letters.

ASCII_table

1
2
3
4
5
6
7
8
9
letters = [0] * 26

for char in message:
if char >= 'A' and char <= 'Z':
letters[ord(char) - 65] += 1
elif char >= 'a' and char <= 'z':
letters[ord(char) - 97] += 1
print(letters)
#[29, 3, 14, 12, 33, 3, 15, 10, 25, 2, 0, 21, 8, 19, 20, 15, 0, 19, 21, 22, 5, 1, 3, 0, 7, 1]

extra

Write a Python program to search a list for the first int object which is divisible by 13.
You may test your program with the list [12, “COMP”, 999.9, “2022”, 26, “Great”]
Hint isinstance()

1
2
3
4
5
6
7
8
9
10
11
12
## Please write your code here
list = [12, "COMP", 999.9, "2022", 26, "Great"]
for item in list:
if isinstance(item, int):
#This is an integer
#print(item, "Check for integer type pass!")
if item % 13 == 0:
#This is divisble by 13
#print(item, "Check for divisible by 13 pass!")
print(item, "is divisible by 13")
break

26 is divisible by 13

Write a Python program to convert the 24 hour clock to a 12 hour clock format.
For example, to get an user input 1532, then output

1
2
3
4
5
6
7
8
9
10
11
12
13
14
15
16
17
18
## Please write your code here
timeIn = input("Please input a time in 24 hour format e.g. 1532 or 0945")
hour = int(timeIn[:2])
minute = int(timeIn[2:])
if minute < 10:
minute = '0' + str(minute)
else:
minute = str(minute)
if (hour > 12):
time = str(hour - 12) + ':' + minute + 'pm'
elif hour == 12:
time = '12' + ':' + minute + 'pm'
elif hour == 0:
time = '12' + ':' + minute + 'am'
else:
time = str(hour) + ':' + minute +'am'

print(time)
Please input a time in 24 hour format e.g. 1532 or 0945 1532


3:32pm

HW1

  1. Write a Python program with function to sum of two given integers. However, if the sum is between 15 to 20 it will return 20.

For example:

if a=10, b =6, it will return 20

if a=10, b=2, it will return 12

if a=10, b=12, it will return 22

DONOT PRINT IN THE FUNCTION.

1
2
3
4
5
6
7
8
9
10
11
12
def sum(x, y):
#Write your code below
result = x + y
if result >= 15 and result <= 20:
return 20
else:
return result


print(sum(10, 6))
print(sum(10, 2))
print(sum(10, 12))
20
12
22
  1. Please transfer the following equation into Python
    $y=\sqrt{(a-b)^2+(a+b)^2}$.

You can use a function in math library for sqrt
#DO NOT PRINT IN THE FUNCTION!!

1
2
3
4
5
6
7
8
9
10
11
12
13
14
15
import math
def ED(a, b):
##Please write your code below
x = pow((a - b),2)
y = pow((a + b),2)
res = pow((x + y),0.5)
return res


print(ED(3, 5))
print(ED(7, 8))
print(ED(8, 9))


8.246211251235321
15.033296378372908
17.029386365926403
  1. Write a Python program to check if a number is positive, negative or zero.
    Hint: if elif else

num is provided in the first line using input(“Input a number”). You can input any numbers you like.

1
2
3
4
5
6
7
8
9
num = float(input("Input a number: "))
##Write your code with if elif else below
if num > 0:
print('positive')
elif num == 0:
print('zero')
else:
print('negative')

Input a number: -1
negative
  1. Write a Python program to calculate the sum of three given numbers, if the values of each number are equal then return thrice of their sum else please return their sum directly.

For example,

if x = 3, y = 3, z = 3, return 27

if x = 1, y = 2, z = 3, return 6

1
2
3
4
5
6
7
8
9
10
def sum_thrice(x, y, z):
if x == y and y == z:
return x*x*x
else:
return x + y +z


print(sum_thrice(1, 2, 3))
print(sum_thrice(0, 4, 5))
print(sum_thrice(3, 3, 3))
6
9
27
  1. Write a Python program to find whether a given number is even or odd, print out an appropriate message to users.

For example:

if the number is even, print “The number is even” otherwise print “The number is odd”

1
2
3
4
5
6
7
8
9
def judgenum(num):
if num%2 == 0:
print('The number is even')
else:
print('The number is odd')

judgenum(1)
judgenum(2)
judgenum(3)
The number is odd
The number is even
The number is odd
  1. Write a Python program to get the volume of a sphere with given radius values.
    The volume of the sphere is : $V = 4/3 × π × r^3$.
    DONOT PRINT IN FUNCTION
1
2
3
4
5
6
7
8
9
10
import math

def volume(radius):
##show your codes
v = (4/3) * math.pi * pow(radius,3)
return v

print(volume(4))
print(volume(5))
##PLEASE ENSURE THAT YOUR RESULTS ARE DISPLAYED BY PRINT HERE.
268.082573106329
523.5987755982989
  1. Write a Python program to append list1 to list2.
1
2
3
4
5
6
list1 = [1, 2, 3, 0]
list2 = ['Red', 'Green', 'Black']
##Write your code blew and rember to display them
list3 = list1 + list2
list2 = list3
print(list2)
[1, 2, 3, 0, 'Red', 'Green', 'Black']
  1. Write a Python program to get the largest number from a list.

For example:
We can use max([1,2,3]) to get the largest number of a list. Now, please do not use max() and write a fuction for this purpose yourself.

Requirements:

a. Donot use max(a list) to get the largest number, otherwise you can only get the minimum point.

b. Donot print the value inside the function. Just return them.

1
2
3
4
5
6
7
8
9
10
11
12
13
14
15
16
17
18
def max_num_in_list( list ):
# tmp = 0
# for i in list:
# if i > tmp:
# tmp = i
# return tmp


tmp = 0
for i in range(0,len(list)):
if list[i] > tmp:
tmp = list[i]
return tmp


print(max_num_in_list([1, 2, -8, 0]))
print(max_num_in_list([3, 3, -1, 1]))
2
3
  1. Write a Python program to sum all the items in a list.

For a list [1, 2, -8], we can use sum([1, 2, -8]) for this purpose.
Now, donot use sum(). Write this function yourself.

1
2
3
4
5
6
7
8
9
def sum_list(items):
result = 0
for i in items:
result = result + i
return result


print(sum_list([1,2,-8]))
print(sum_list([3,2,-8]))
-5
-3
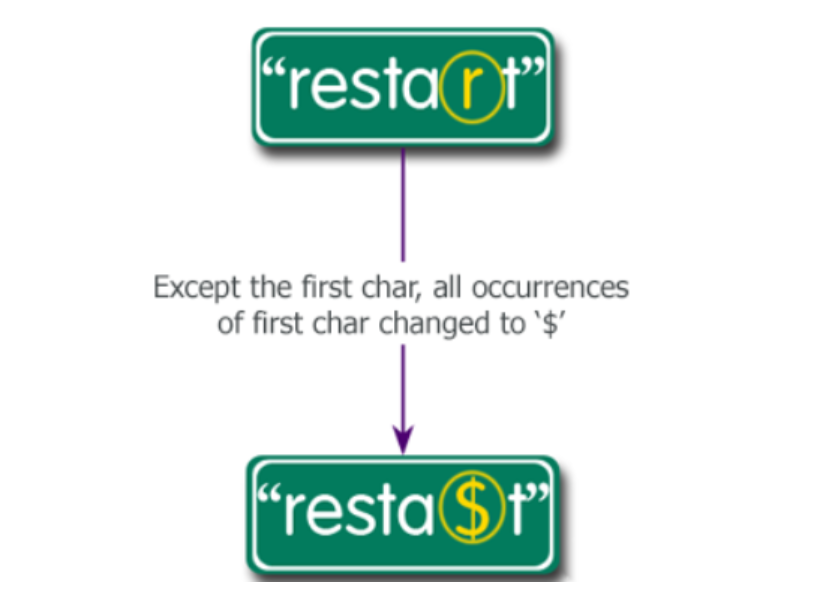
  1. Write a Python program to get a string from a given string where all occurrences of its first char have been changed to ‘$’, except the first char itself.

image-20221012015831837

1
2
3
4
5
6
7
8
9
10
11
12
def change_char(str1):
s = list(str1)
for i in range(1,len(s)):
if s[i] == s[0]:
s[i] = '$'
res = ''.join(s)
return res


print(change_char('restart'))
resta$t

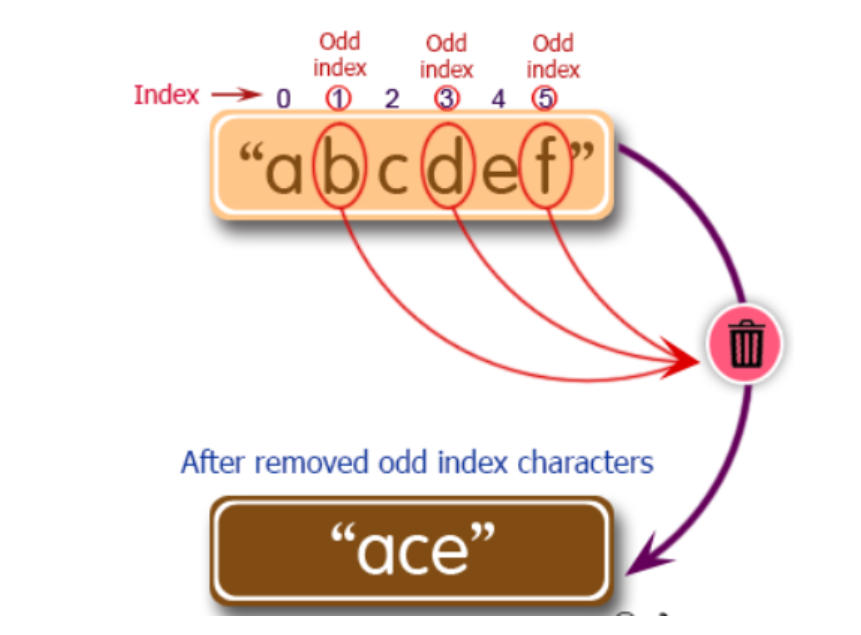
11.Write a Python program to remove the characters which have odd index values of a given string.

image-20221012015501267

1
2
3
4
5
6
7
8
9
10
11
12
def odd_values_string(str):
s = list(str)
s2 = []
for i in range(0,len(s)):
if i % 2 == 0:
s2.append(s[i])
res = ''.join(s2)
return res


print(odd_values_string('abcdef'))
print(odd_values_string('python'))
ace
pto

Lab4 IO

Q1

1
2
3
4
5
6
file = open('./districts.txt','r')
districts = [line for line in file]
districts.sort()
for i in range(0,18):
print(districts[i])
file.close()
1
2
3
4
5
6
7
8
9
10
11
12
13
14
15
16
17
18
19
20
21
22
23
24
25
26
27
28
29
30
31
32
33
34
35
36
Central and Western

Eastern

Islands

Kowloon City

Kwai Tsing

Kwun Tong

North

Sai Kung

Sha Tin

Sham Shui Po

Southern

Tai Po

Tsuen Wan

Tuen Mun

Wan Chai

Wong Tai Sin

Yau Tsim Mong

Yuen Long

Q2

1
2
3
4
5
6
7
8
9
10
11
import os
path = './data'
emails = []
for file in os.listdir(path):
file = open(path + '//' + file, 'r')
for line in file:
if '@' in line:
emails.append(line.rstrip('\n'))
file.close()
emails.sort()
print(emails)
1
['choi@comp.hkbu.edu.hk', 'chxw@comp.hkbu.edu.hk', 'jiming@comp.hkbu.edu.hk', 'jng@comp.hkbu.edu.hk', 'pcyuen@comp.hkbu.edu.hk', 'william@comp.hkbu.edu.hk', 'xujl@comp.hkbu.edu.hk', 'yikeguo@hkbu.edu.hk', 'ymc@comp.hkbu.edu.hk', 'ywleung@comp.hkbu.edu.hk']

Q3

1
2
3
4
5
6
7
8
with open('week4.txt','w') as file:
file.write("This is the first line\n")
file.write("This is the second line\n")
file.write("The end\n")

#new content to an existinf file
with open('week4.txt','a') as file:
file.write("Extra line added\n")

Q4 Get current directory

1
2
import os
os.getcwd()
1
'C:\\Users\\f2401539\\Desktop'

Q5

1
2
3
4
5
6
file = open(os.getcwd() + '\districts.txt','r')
districts = [line for line in file]
districts.sort()
for i in range(0,18):
print(districts[i])
file.close()
1
2
3
4
5
6
7
8
9
10
11
12
13
14
15
16
17
18
19
20
21
22
23
24
25
26
27
28
29
30
31
32
33
34
35
Central and Western

Eastern

Islands

Kowloon City

Kwai Tsing

Kwun Tong

North

Sai Kung

Sha Tin

Sham Shui Po

Southern

Tai Po

Tsuen Wan

Tuen Mun

Wan Chai

Wong Tai Sin

Yau Tsim Mong

Yuen Long

Q6 write and read csv

1
2
3
4
5
6
7
8
9
10
import csv

courses = [['Course Code', 'Year', 'Semester','Course Name'],
['COMP7035', '2022-23', 'Sem A', 'Python for Data Analytics and Artificial Intelligence'],
['COMP1007', '2021-22', 'Sem B','Introduction to Python and Its Applications']]
f = open('courses.csv','w')
with f:
writer = csv.writer(f)
for row in courses:
writer.writerow(row)
1
2
3
4
5
6
7
8
import csv
f = open('courses.csv','r')

with f:
reader = csv.reader(f)
for row in reader(f)
for row in reader:
print(row)
1
2
3
4
5
6
['Course Code', 'Year', 'Semester', 'Course Name']
[]
['COMP7035', '2022-23', 'Sem A', 'Python for Data Analytics and Artificial Intelligence']
[]
['COMP1007', '2021-22', 'Sem B', 'Introduction to Python and Its Applications']
[]

Lab5 Numpy

create an array of the integers from 20 to 50

1
2
3
import numpy as np
array = np.arange(20,51)
print(array)
1
[20 21 22 23 24 25 26 27 28 29 30 31 32 33 34 35 36 37 38 39 40 41 42 43 44 45 46 47 48 49 50]

create an array of the integers from 0 to 50 with evenly spacing of 10

1
2
3
import numpy as np

array = np.linspace(0,50,6)
1
[ 0. 10. 20. 30. 40. 50.]

show different properties of the numpy array

1
2
3
4
5
6
7
8
9
10
11
12
13
import numpy as np

array = np.arange(20)
print(array)

array = array.reshape(4,5)
print(array)
print(type(array))
print(array.ndim)
print(array.shape)
print(array.dtype)
print(array.itemsize)
print(array.size)
1
2
3
4
5
6
7
8
9
10
11
12
13
14
15
16
17
18
[ 0  1  2  3  4  5  6  7  8  9 10 11 12 13 14 15 16 17 18 19]

[[ 0 1 2 3 4]
[ 5 6 7 8 9]
[10 11 12 13 14]
[15 16 17 18 19]]

<class 'numpy.ndarray'>

2

(4, 5)

int32

4

20

create an array of thre integers from 9 to 31 and print all values except the first and the last

1
2
3
import numpy as np
array = arange(9,32)
print(array[1:-1])
1
[10 11 12 13 14 15 16 17 18 19 20 21 22 23 24 25 26 27 28 29 30]

create an array of 5 zeros, 5 ones, 5 fives

1
2
3
4
5
6
7
8
9
10
11
12
import numpy as np
print('An array of 5 zeros:')
array = np.zeros(5)
print(array)

print('An array of 5 ones:')
array = np.ones(5)
print(array1)

print('An array of 5 fives:')
array = np.ones(5) * 5
print(2)
1
2
3
4
5
6
An array of 5 zeros:
[0. 0. 0. 0. 0.]
An array of 5 ones:
[1. 1. 1. 1. 1.]
An array of 5 fives:
[5. 5. 5. 5. 5.]

create 5x5 zero matrix with elements with the diagonal to 5,4,3,2,1

1
2
3
import numpy as np
array = np.diag([5,4,3,2,1])
print(array)
1
2
3
4
5
[[5 0 0 0 0]
[0 4 0 0 0]
[0 0 3 0 0]
[0 0 0 2 0]
[0 0 0 0 1]]

find missing item in a given array

1
2
3
4
5
6
7
import numpy as np

array = np.array([[1,1,np.nan,1],
[np.nan,1,1,1],
[1,np.nan,1,1]])
print('\nFind the missing data of the said array:')
print(np.isnan(array))
1
2
3
4
Find the missing data of the said array:
[[False False True False]
[ True False False False]
[False True False False]]

indexing row and col

1
2
3
4
5
6
7
import numpy as np
array = np.array(([5,10,15],[20,25,30],[35,40,45]))
array[1]
array[1][0]
print(array)
print('----')
print(array[:2,1:])
1
2
3
4
5
6
7
8
array([20, 25, 30])
20
[[ 5 10 15]
[20 25 30]
[35 40 45]]
----
[[10 15]
[25 30]]

Lab6 Matplotlib

Simple plots

1
2
3
4
5
6
7
import matplotlib.pylot as plt
import numpy as np
import pandas as pd

x = [1,2,3]
y = [50,100,150]
plt.plot(x,y)

Add the title and x, y label

1
2
3
4
5
6
7
8
x = [1, 2, 3]
y = [50, 100, 150]

plt.plot(x, y)
plt.title("Title")
plt.xlabel("Label X")
plt.ylabel("Label Y")
plt.show()

fit the line:xlim(), ylin()

1
2
3
4
5
6
7
8
9
10
x = [1, 2, 3]
y = [50, 100, 150]

plt.xlim(1,3)
plt.ylim(0,140)
plt.plot(x, y)
plt.title("Title")
plt.xlabel("Label X")
plt.ylabel("Label Y")
plt.show()

customize

1
2
3
4
5
6
7
8
plt.plot(x, y, color="green", marker='>', markersize=20, linestyle='dashdot')

plt.xlim(1, 3)
plt.ylim(0, 150)

plt.title('Title')
plt.xlabel('Label X')
plt.ylabel('Label Y');

example

1
2
3
4
5
6
7
8
9
10
df = read_csv('elderly.csv')
year = df['Year'].values.tolist()
print(year)
sixtyFiveAbove = df['65 years old and above'].values.tolist()
print(sixtyFiveAbove)

plt.plot(year, sixtyFiveAbove, color="green", marker='>', markersize=20, linestyle='dashdot')
plt.title('Title')
plt.xlabel('Label X')
plt.ylabel('Label Y');
1
2
[2010, 2011, 2012, 2013, 2014, 2015, 2016, 2017, 2018, 2019, 2020]
['836', '859', '892', '931', '975', '1,022', '1,067', '1,116', '1,164', '1,222', '1,297']

image-20221115231845515

Example2

1
2
3
4
5
6
7
8
9
10
11
12
13
14
15
16
17
18
19
20
21
22
23
import random

n1 = 100
n2 = 1000
n3 = 100000
def rolls_plt(arg):
num = [0] * 6
y = []
x = [1,2,3,4,5,6]

for i in range(arg):
r_num = random.randint(0,5)
num[r_num] = num[r_num] + 1

for i in range(6):
y_fre = num[i] / arg
y.append(y_fre)
plt.bar(x,y,color = 'royalblue')
plt.show()

rolls_plt(n1)
#rolls_plt(n2)
#rolls_plt(n3)

image-20221115232029804

Example3

𝑥=𝑐𝑜𝑠(𝜃)x=cos(θ)

𝑦=𝑠𝑖𝑛(𝜃)+𝑐𝑜𝑠(𝜃)2/3

1
2
3
4
5
6
7
8
9
10
11
import numpy as np
from matplotlib import pyplot as plt
import math

theta = np.linspace(0, 2 * np.pi, 100)
x = np.cos(theta)
y = np.sin(theta) + np.cos(theta) ** 2/3


plt.plot(x, y)
plt.show()

image-20221115232115184

Example4

1
2
3
4
5
6
7
8
9
10
11
12
13
14
15
16
17
18
19
20
21
22
23
import matplotlib.pyplot as plt
from matplotlib import animation
import numpy as np
from IPython.display import display, clear_output

fig = plt.figure() #Create a canvas to be painted

x = np.cos(theta)
y = np.sin(theta) + np.cos(theta) ** 2/3

ax = fig.subplots()
l = ax.plot(x,y)
l = l[0]

def animate(i):
l.set_data(x[:i],y[:i])
return 1

for i in range(len(x)):
animate(i)
clear_output(wait = True)
display(fig)
plt.show()

image-20221115232217987

Lab7 Seaborn/class

Write a class for Person

Basic Properties: Age, Name, Sex.

Extension Properties: Working, Sleepings, just consider the hours they work and sleep everyday.

Then, instantiate the two classes into to different persons

1
2
3
4
5
6
7
8
9
10
11
12
13
14
15
16
class Person:
def __init__(self, name, age, sex):
self.name = name
self.age = age
self.sex = sex
def Working(self, hours):
print(self.name + 'working' + str(hours) + "hours everyday")
def Sleep(self, hours):
print(self.name + 'sleep' + str(hours) + "hours everyday")

object1 = Person('jack',18,'male')
object2 = Person('mark',19,'male')
print(object1.name, object1.age, object1.sex)
print(object2.name, object2.age, object2.sex)
object1.Working(4)
object2.Sleep(4)
1
2
3
4
jack 18 male
mark 19 male
jack working 4 hours everyday
mark sleeping 4 hours everyday

Create a matrix with the following style(pad)

1
2
3
import numpy as np
a = [[1,2],[3,4]]
a_pad = np.pad(a,((1,9),(3,3)),'constant')
1
2
3
4
5
6
7
8
9
10
11
12
[[0 0 0 0 0 0 0 0]
[0 0 0 1 2 0 0 0]
[0 0 0 3 4 0 0 0]
[0 0 0 0 0 0 0 0]
[0 0 0 0 0 0 0 0]
[0 0 0 0 0 0 0 0]
[0 0 0 0 0 0 0 0]
[0 0 0 0 0 0 0 0]
[0 0 0 0 0 0 0 0]
[0 0 0 0 0 0 0 0]
[0 0 0 0 0 0 0 0]
[0 0 0 0 0 0 0 0]]

Create a matrix with the following style

1
2
3
4
import numpy as np
a = np.arange(1,4)
a_d = diag(a)
print(a_d)
1
2
3
4
[[1. 0. 0. 0.]
[0. 2. 0. 0.]
[0. 0. 3. 0.]
[0. 0. 0. 4.]]

Seaborn->pass

Lab8 Pandas_1

Exam1

1. Create a 5-D random numpy list var_list

1
2
import numpy as np
var_list = np.random.randn(5)

2. use “uuid” to generate 5 random keys (use str(uuid.uuid4())), and store them into a list key_list

1
2
import uuid
key_list = [str(uuid.uuid4())[:6] for i in range(5)]

3. Create a dictionary dict from var_list and key_list

1
dict_tmp = {key_list[i]:var_list[i] for i in range(5)}

4. Create a Pandas Series from a) var_list b) var_list and key_list c) dict

1
2
3
4
import pandas as pd
pd_series_var = pd.Series(var_list)
pd_series_var_key = pd.Series(var_list,key_list)
pd_series_dict = pd.Series(dict_tmp)

5. Convert the Series back to the list and dictionary

1
2
var_list_new = pd_series_var_key.to_list()
dict_new = pd_series_dict.to_dict()

6. Find out the elements larger than zero

1
pd_series_positive = pd.series_dict[pd_series_dict > 0]

7. Calculate the proportion of positive elements in the Series

1
proportion = len(pd_series_postive)/len(pd_series_dict)

8. Write down as many ways of forming a list that contains the values of Series elements

1
2
3
4
5
6
7
8
val_1 = pd_series_dict.to_list()
val_2 = []

for idx, ival in pd_series_dict.iteritems():
val_2.append(ival)
val_3 = pd_series_dict.values
val_tmp = pd_series_dict.index
val_4 = [pd_series_dict[ikey] for ikey in pd_series_dict.index]

9. Calculate the proportion of elements that are larger than the mean value of the Series

1
2
3
mean_val = np.mean(pd_series_dict)
pd_series_larger_than_mean = pd_series_dict[pd_series_dict > mean_val]
proportion_2 = len(pd_series_larger_than_mean)/len(pd_series_dict)

Exam2

1. Write codes to create a random dict x which has 5 random keys and each key corresponds to a 6-D numpy array

1
2
3
4
5
6
7
import uuid
data = {}
key_list = []
for i in range(5):
rand_key = str(uuid.uuid4())[:6]
key_list.append(rand_key)
data[rand_key] = np.random.randn(6)

2. Create a pandas dataframe using x

1
2
df = pd.DataFrame(data)
print(df)

3. Create a pandas dataframe using a subset of x, in the subset of x, only keys that start with a digit are chosen

1
2
3
4
sub_key_list = [i_key for i_key in key_list if i_key[0] in '0123456789']
print(sub_key_list)
df_sub = pd.DataFrame(data,columns = sub_key_list)
print(df_sub)

4. Create a new pandas dataframe using the codes in the previous slide

1
2
3
dates = pd.data_range('1/1/2000',periods = 8)
df = pd.DataFrame(np.random.randn(8,4),index = dates, columns = ['A','B','C','D'])
print(df)

5. Select rows whose attribute A is smaller than the mean of attribute C

1
2
3
4
5
df_c = df['C']
print(df_c)
mean_c = np.mean(df_c)
print(mean_c)
print(df[df['A']<mean_c])

6. Can you select the column B and C using [] indexing? Try it out and see what happens

1
2
df_bc = df[['B','C']]
print(df_bc)

Exam3

convert a Panda module Series to Python list

1
2
3
4
5
6
7
8
9
10
import pandas as pd

series = pd.Series([1, 2, 3, 4, 5])
print("Pandas Series and type")
print(series)
print(type(series))

print("Convert Pandas Series to Python list")
print(series.tolist())
print(type(series.tolist()))
1
2
3
4
5
6
7
8
9
10
11
Pandas Series and type
0 1
1 2
2 3
3 4
4 5
dtype: int64
<class 'pandas.core.series.Series'>
Convert Pandas Series to Python list
[1, 2, 3, 4, 5]
<class 'list'>

convert a dictionary to a Pandas series

1
2
3
4
5
6
7
8
9
import pandas as pd

dict = {'a': 100, 'b': 200, 'c':300, 'd':400, 'e':500}
print("Original dictionary:")
print(dict)

new_series = pd.Series(dict)
print("Converted series:")
print(new_series)
1
2
3
4
5
6
7
8
9
Original dictionary:
{'a': 100, 'b': 200, 'c': 300, 'd': 400, 'e': 500}
Converted series:
a 100
b 200
c 300
d 400
e 500
dtype: int64

convert a NumPy array to a Pandas series

1
2
3
4
5
6
7
8
9
10
import numpy as np
import pandas as pd

np_array = np.array([1, 2, 3, 4, 5])
print("NumPy array:")
print(np_array)

new_series = pd.Series(np_array)
print("Converted Pandas series:")
print(new_series)
1
2
3
4
5
6
7
8
9
NumPy array:
[1 2 3 4 5]
Converted Pandas series:
0 1
1 2
2 3
3 4
4 5
dtype: int32

convert the column of a DataFrame as a Series

1
2
3
4
5
6
7
8
9
10
11
12
13
import pandas as pd

d = {'col1': [1, 2, 3, 4, 7, 11], 'col2': [4, 5, 6, 9, 5, 0], 'col3': [7, 5, 8, 12, 1,11]}
df = pd.DataFrame(data=d)
print(type(df))

print("Original DataFrame")
print(df)
s1 = df.iloc[:,0]

print("\n1st column as a Series:")
print(s1)
print(type(s1))
1
2
3
4
5
6
7
8
9
10
11
12
13
14
15
16
17
18
19
<class 'pandas.core.frame.DataFrame'>
Original DataFrame
col1 col2 col3
0 1 4 7
1 2 5 5
2 3 6 8
3 4 9 12
4 7 5 1
5 11 0 11

1st column as a Series:
0 1
1 2
2 3
3 4
4 7
5 11
Name: col1, dtype: int64
<class 'pandas.core.series.Series'>

Create a subset of a series

1
2
3
4
5
6
7
8
9
10
mport pandas as pd

s = pd.Series([0,1,2,3,4,5,6,7,8,9,10,11,12,13,14,15])
print("Original Data Series:")
print(s)

print("\nSubset of the above Data Series:")
n = 10
new_s = s[s > n]
print(new_s)
1
2
3
4
5
6
7
8
9
10
11
12
13
14
15
16
17
18
19
20
21
22
23
24
25
26
Original Data Series:
0 0
1 1
2 2
3 3
4 4
5 5
6 6
7 7
8 8
9 9
10 10
11 11
12 12
13 13
14 14
15 15
dtype: int64

Subset of the above Data Series:
11 11
12 12
13 13
14 14
15 15
dtype: int64

Lab9 Pandas_2

1
2
import numpy as np
import pandas as pd

1. Write codes to create two DataFrames df_left, df_right, with the columns as “[key, lval1, lval2]” and “[key, rval1, rval2]”, and the values are “[a,b,c]”, and “[b,c,d]” respectively. Generate random numbers with normal distribution to for the “lval” and “rval” elements

1
2
3
4
5
6
split_str = '_______'
left_df = pd.DataFrame({'key':['a','b','c'],'lval1':np.random.randn(3),'lval2':np.random.randn(3)})
right_df = pd.DataFrame({'key':list('bcd'),'rval1':np.random.randn(3),'rval2':np.randoom.randn(3)})
print(left_df)
print(split_str)
print(right_df)
1
2
3
4
5
6
7
8
9
  key     lval1     lval2
0 a -0.306740 0.370246
1 b -1.633727 -0.351369
2 c 1.558975 -0.179692
---------
key rval1 rval2
0 b -0.036699 0.724182
1 c -1.241680 -1.695795
2 d 1.580775 -1.271330

2. Compute the left outer join of df_left and df_right, check out the results

1
2
left_merge = pd.merge(left_df, right_df, how = 'left')
print(left_merge)
1
2
3
4
  key     lval1     lval2     rval1     rval2
0 a -0.306740 0.370246 NaN NaN
1 b -1.633727 -0.351369 -0.036699 0.724182
2 c 1.558975 -0.179692 -1.241680 -1.695795

3. Change the name “key” of df_left to “key_left”, re-run step 2 and see what happens

1
left_df.columns = ['key_left','lval1','lval2']

4. Compute the right outer join of df_left and df_right in step 2, check out the results

1
2
right_merge = pd.merge(left_df, right_df, how = 'right')
print(right_merge)
1
2
3
4
  key     lval1     lval2     rval1     rval2
0 b -1.633727 -0.351369 -0.036699 0.724182
1 c 1.558975 -0.179692 -1.241680 -1.695795
2 d NaN NaN 1.580775 -1.271330

5. Compute the full outer join of df_left and df_right in step 2, check out the results

1
2
outer_merge = pd.merge(left_df, right_df, how = 'outer')
print(outer_merge)
1
2
3
4
5
  key     lval1     lval2     rval1     rval2
0 a -0.306740 0.370246 NaN NaN
1 b -1.633727 -0.351369 -0.036699 0.724182
2 c 1.558975 -0.179692 -1.241680 -1.695795
3 d NaN NaN 1.580775 -1.271330

6. Compute the inner join of df_left and df_right in step 2, check out the results

1
2
inner_merge = pd.merge(left_df, right_df, how = 'inner')
print(inner_merge)
1
2
3
  key     lval1     lval2     rval1     rval2
0 b -1.633727 -0.351369 -0.036699 0.724182
1 c 1.558975 -0.179692 -1.241680 -1.695795

7. Get the floating value columns of df_left (lval1,lval2), get the square root of the absolute values using apply

1
2
3
4
5
6
7
8
9
print(left_df)
left_df_val = left_df[['lval1','lval2']]
print(left_df_val)

left_df_val_abs = left_df_val.apply(np.abs)
print(left_df_val_abs)

left_df_val_abs_sqrt = left_df_val_abs.apply(np.sqrt)
print(left_df_val_abs_sqrt)
1
2
3
4
5
6
7
8
9
10
11
12
13
14
15
16
  key     lval1     lval2
0 a -0.306740 0.370246
1 b -1.633727 -0.351369
2 c 1.558975 -0.179692
lval1 lval2
0 -0.306740 0.370246
1 -1.633727 -0.351369
2 1.558975 -0.179692
lval1 lval2
0 0.306740 0.370246
1 1.633727 0.351369
2 1.558975 0.179692
lval1 lval2
0 0.553841 0.608478
1 1.278173 0.592764
2 1.248589 0.423901

8. Try using numpy to directly calculate the above operations on df_left

1
2
left_df_val_abs_sqrt_np = np.sqrt(np.abs(left_df_val))
print(left_df_val_abs_sqrt_np)
1
2
3
4
      lval1     lval2
0 0.553841 0.608478
1 1.278173 0.592764
2 1.248589 0.423901

9. Write the apply_map functions to accomplish step 7

1
2
3
4
5
6
7
print(left_df)
left_df_val = left_df[['lval1','lval2']]
print(left_df_val)
left_df_val_abs = left_df_val.applymap(np.abs)
print(left_df_val_abs)
left_df_val_abs_sqrt = left_df_val_abs.applymap(np.sqrt)
print(left_df_val_abs_sqrt)
1
2
3
4
5
6
7
8
9
10
11
12
13
14
15
16
  key     lval1     lval2
0 a -0.306740 0.370246
1 b -1.633727 -0.351369
2 c 1.558975 -0.179692
lval1 lval2
0 -0.306740 0.370246
1 -1.633727 -0.351369
2 1.558975 -0.179692
lval1 lval2
0 0.306740 0.370246
1 1.633727 0.351369
2 1.558975 0.179692
lval1 lval2
0 0.553841 0.608478
1 1.278173 0.592764
2 1.248589 0.423901

10. Get the data of “Countries and dependencies by area” from wiki and save to the excel excluding index

1
2
3
4
5
6
7
8
9
import requests
url_wiki = 'https://en.wikipedia.org/wiki/List_of_countries_and_dependencies_by_area'
r = requests.get(url_wiki,headers ={'User-Agent':'Mozilla/5.0 (Windows NT 10.0;Win64; x64) AppleWebKit/537.36 (KHTML, like Gecko) Chrome/91.0.4472.124Safari/537.36'})

data = pd.read_html(r.text)
print([idata.shape for idata in data])
data_area = data[1]
print(data_area)
data_area.to_excel('area_info.xlsx',index = False)

Lab10 Sweetviz

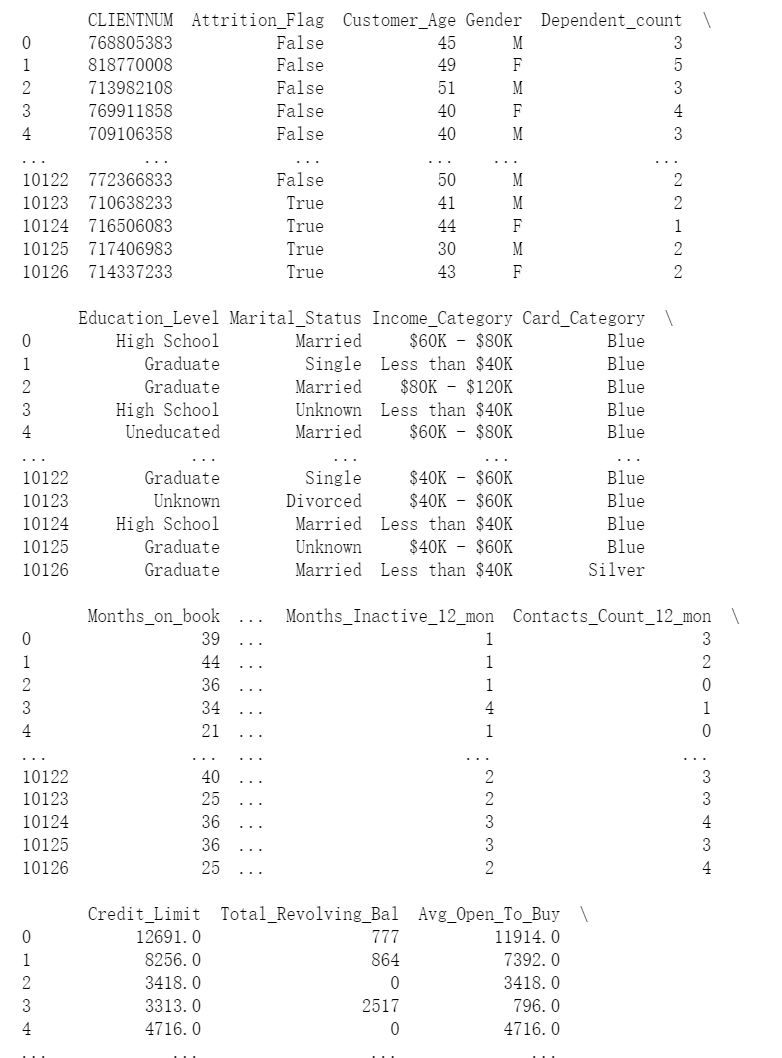
1. Load the BankChurners_clean.csv (download it from Moodle) into the pandas DataFrame

1
2
3
4
5
6
7
8
import pandas as pd
import numpy as np
import sweetviz as sv

df_bank_churners = pd.read_csv('BankChurners_clean.csv')
print(df_bank_churners)


image-20221216165438536

2. Take the first 90% samples of the dataset as training set and take the remaining as test set.

1
2
3
4
5
6
print(df_bank_churners.shape)
n_samples = df_bank_churners.shape[0]
print(n_samples)
n_train = int(n_samples * 0.9)
df_bank_train = df_bank_churners.iloc[:n_train,:]
df_bank_test = df_bank_churners.iloc[n_train:,:]

3. Compare how Attrition_Flag is affected by other variables in the training and test sets.

1
2
3
4
5
comp_bank_churners = sv.compare([df_bank_train, 'train'],
[df_bank_test, 'test'],
target_feat = 'Attribution_flag')

comp_bank_churners.show_notebook()

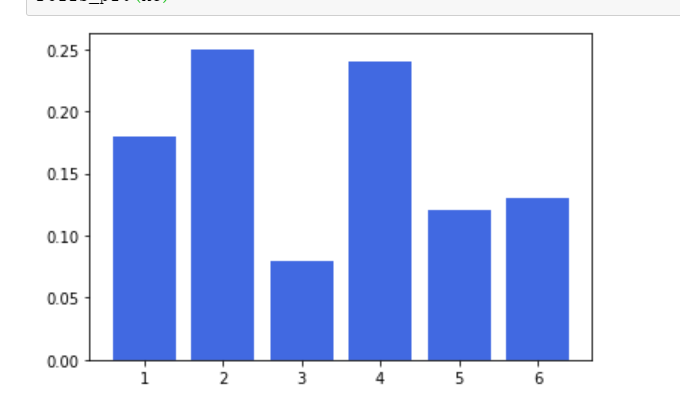
4. For the Customer_Age, let us display the histogram within 5 groups (30,40, 50, 60, 70). What is the proportion of people over 70 years old in the test set? For the test set, Which age group has the lowest rate for “true attrition flag”?

1
2
3
4
ana_bank_churners = sv.analyze([df_bank_train, 'train'],
target_feat = 'Attrition_Flag')

ana_bank_churners.show_notebook()

5. Analyze the training set, find out what variable is most related to theincome category? Make the “Dependent_count” as categorical

1
2
3
4
conf = sv.FeatureConfig(force_cat = 'Dependent_count')
ana_bank_churners = sv.analyze([df_bank_train,'train'],target_feat='Attrition_Flag',feat_cfg = conf)

ana_bank_churners.show_notebook()

6. Show how Attrition_Flag changes for young (age<60) and old groups(age>=60) in the training set.

1
2
3
4
comp_intra_report = sv.compare_intra(df_bank_train,                                    df_bank_train['Customer_Age']<60,
['Young','Old'],
target_feat='Attrition_Flag')
comp_intra_report.show_notebook(scale = 0.1)

Lab11/12 Keras

1.Rather than identifying the actual number, we want to classify whether the digit image contains an odd number. Modify the data generator to produce correct data samples from the MNIST dataset

1
2
3
4
5
6
7
8
9
10
11
12
13
14
15
16
17
18
19
20
21
22
23
24
25
26
27
28
29
30
31
32
33
34
35
import keras, linecache, random
class DataGenerator(keras.utils.Sequence):
'Generates data for Keras'
def __init__(self, csv_path, indexes):
#initilizes some variables
self.csv_path = csv_path
self.norm_factor = 255.0
self.indexes = indexes
#random.shuffle(self.indexes)

def __len__(self):
#return the total number of samples in dataset
return len(self.indexes)
def __getitem__(self, index):
#create one sample according to the index
line_index = self.indexes[index]
line_str = lineache.getline(self.csv_path, line_index)
line_val = [int(i) for i in line_str.split(',')]
label = line = line[0]%2
feat = np.array(line_val[1:])/self.norm_factor
return feat, label

indexes = [i for i in range(60000)]
train_index = indexes[6000:]
val_index = indexes[:6000]
train_set = DataGenerator('mnist_train.csv', train_index)
val_set = DataGenerator('mnist_train.csv', val_index)
print(len(train_set))
print(len(val_set))
cnt = 0
for x, y in train_set:
print(y)
cnt = cnt + 1
if cnt >= 5:
break

2.We want to make the input feature normalized to [-1,1]. What shall we do?

1
2
3
4
5
6
7
8
9
10
11
12
13
14
15
16
17
18
19
20
21
22
23
24
25
26
27
28
class DataGenerator(keras.utils.Sequence):
def __init__(self, csv_path, indexes):
self.csv= csv_path
self.norm_factor = 255.0
self.indexes = indexes
def __len__(self):
return len(self.indexes)
def __getitem__(self, index):
line_index = self.indexes[index]
line_str = linecache.getline(self.csv_path, line_index)
line_val = [int(i) for i in line+str.split(',')]
label = line_val[0]
feat = np.array(line_val[1:])/self.norm_factor
feat = featt*2-1
return feat, label
indexes = [i for i in range(6000)]
train_index = indexes[6000:]
val_index = indexes[:6000]
train_set = DataGenerator('mnist_train.csv', train_index)
val_set = DataGenerator('mnist_train.csv', val_index)
print(len(train_set))
print(len(val_set))
cnt = 0
for x, y in train_set:
print(y)
cnt = cnt + 1
if cnt >= 5:
break

3.Define a resnet block with all weight layers as 256-node dense layers.

1
2
3
4
5
6
7
8
9
10
11
12
13
14
15
from keras.model import Model
from keras.layers import Dense, Input, Add, Relu

def Resnet_model():
input_tensor = Input(shape=(256,))
layer1 = Dense(256, activation='relu')
layer2 = Dense(256)

fx = layer1(input_tensor)
fx = layer2(fx)
y = Add()([fx, input_tensor])
y_out = ReLU()(y)
model = Model(inputs = input_tensor, outputs = y_out)

return model

4.Define a large resnet consisting of 80 resnet blocks.

1
2
3
4
5
6
x = Input(shape(256,))
y = x
for ii in range(80):
y = Resnet_module()(y)
resnet = Model(inputs = x, outputs = y)
renet.summary()

Lab13 Sklearn

Standardization

1
2
3
4
5
6
7
8
9
from sklearn import preprocessing
import numpy as np
X_train = np.array([[1., 01., 2.],[2., 0., 0.],[0., 1., -1]])
print(X_train.mean(axis = 0))
print(X_train.std(axis = 0))
scaler = preprocessing.StandardScaler().fit(X_train)
X_scaled = scaler.transform(X_train)
print(X_scaled.mean(axis = 0))
print(X_scled.std(axis = 0))

Normalization

1
2
3
4
5
6
7
8
from sklearn import preprocessing
import numpy as np
X_train = np.array([[1., -1., 2.],[2., 0., 0.], [0., 1., -1.]])
print(X_train.mean(axis = 0))
print(X_train.std(axis = 0))
X_normalized = preprocessing.normalize(X_train, norm = '12')
print(X_normalized)
print(np.sum(X_normalized*X_normalized, axis = 1))

PCA

1
2
3
4
5
6
7
import numpy as np
import sklearn.decomposition import PCA
X = np.random.radn(5, 20)
pca = PCA(n_components = 2)
pca.fit(X)
Y = pca.transform(X)
print(Y)

K-Means

1
2
3
4
5
6
7
8
9
10
11
from sklearn.datasets import make_blobs
import matplotlib.pyplot as plt
from sklearn.cluster import KMeans

X, y_true = make_blobs(n_samples = 400, centers = 4, cluster_std = 0.60, random_state = 0)
print(X.shape)
X = X[;, ::-1]
kmeans = Kmeans(4)
kmeans.fit(X)
labels = kmeans.predict(X)
plt.scatter(X[:, 0], X[:, 1], c = labels, s = 40, camp = 'virdis')

Exercise

1
2
3
4
5
6
7
8
9
10
from sklearn import datasets
from sklearn.moddel_selection import train_test_split
from sklearn.metrics import accuracy_score
from sklearn.decomposition import PCA

digits = datasets.load_digits()
X_digits = digits.data
y_digits = digits.target
print(X_digits.shape)
print(y_digits.shape)

1.Split the Digits Dataset (load_digits) into training and testing sets with ratio 9:1

1
X_train, X_test, y_train, y_test = train_test_split(X_digits, y_digits, test_size = 0.1)

2.Standardize the data for each dimension

1
2
3
scaler = preprocessing.StandardScaler().fit(X_train)
X_train_new = scaler.transform(X_train)
X_test_new = scaler.transform(X_test)

3.Reduce the dimension to 32 using PCA

1
2
3
4
5
pca = PCA(32)
pca.fit(X_train_new)
X_train_new = pca.transform(X_train_new)
X_test_new = pca.transform(X_test_new)
print(X_train_new.shape)

4.Train a SVM classifier

1
2
3
4
5
model = svm.SVC()
model.fit(X_train_new, y_train)
y_pred = model.predict(X_test_new)

print(accuracy_score(y_pred, y_test))